Less Than Half My AI Coding Spend Is Actually Writing Code
A real-data breakdown of where the money actually goes. Measured, not estimated.
Over the last 30 days I spent $7,890 across 105,718 AI coding API calls. I assumed most of that was the models writing code. It was not. Only 47.9% of my spend went to actually producing code. The rest went to exploring codebases, debugging, delegating to subagents, and plain back-and-forth conversation.
I only know this because I built a tool to measure it. CodeBurn is a CLI that reads your AI coding session data directly from disk and classifies every API call into one of 13 task categories. No API keys, no wrappers, no data leaving your machine. The classification is fully deterministic, based on tool-usage patterns and message content rather than an LLM, so the numbers are reproducible. Every call is priced at public API rates, so these dollar figures are real money if you pay per token, or the equivalent value of what you burned if you are on a flat subscription.
Here is where the money actually went:
| Task category | Cost | % of spend |
|---|---|---|
| Coding | $3,781 | 47.9% |
| Exploration | $876 | 11.1% |
| Delegation | $765 | 9.7% |
| Debugging | $695 | 8.8% |
| Feature Dev | $654 | 8.3% |
| Conversation | $462 | 5.9% |
| Brainstorming | $294 | 3.7% |
| Testing | $168 | 2.1% |
| Refactoring | $132 | 1.7% |
| Git Ops | $34 | 0.4% |
| Build/Deploy | $21 | 0.3% |
| Planning | $4 | <0.1% |
| General | $4 | <0.1% |
| Total | $7,890 | 100% |
Coding is the single largest bucket, but it is still less than half. If you group everything that produces code (Coding, Feature Dev, Refactoring, and Testing) you get about 60%. Which means roughly 40% of my spend was the model thinking, not typing: reading files, reasoning about the problem, talking through approaches, and chasing bugs.
That is not waste. Exploration and debugging are real work. But it reframes what I am paying for. I was not buying a code generator. I was buying a collaborator that spends most of its budget understanding the problem before it writes a line.
npx codeburn@latestThe rest of this post walks through how CodeBurn produces numbers like these, using real screenshots from the same workflow.
The Dashboard
Run codeburn with no arguments and you get an interactive TUI dashboard. It loads the last 7 days by default. Arrow keys switch between Today, 7 Days, 30 Days, This Month, and 6 Months.
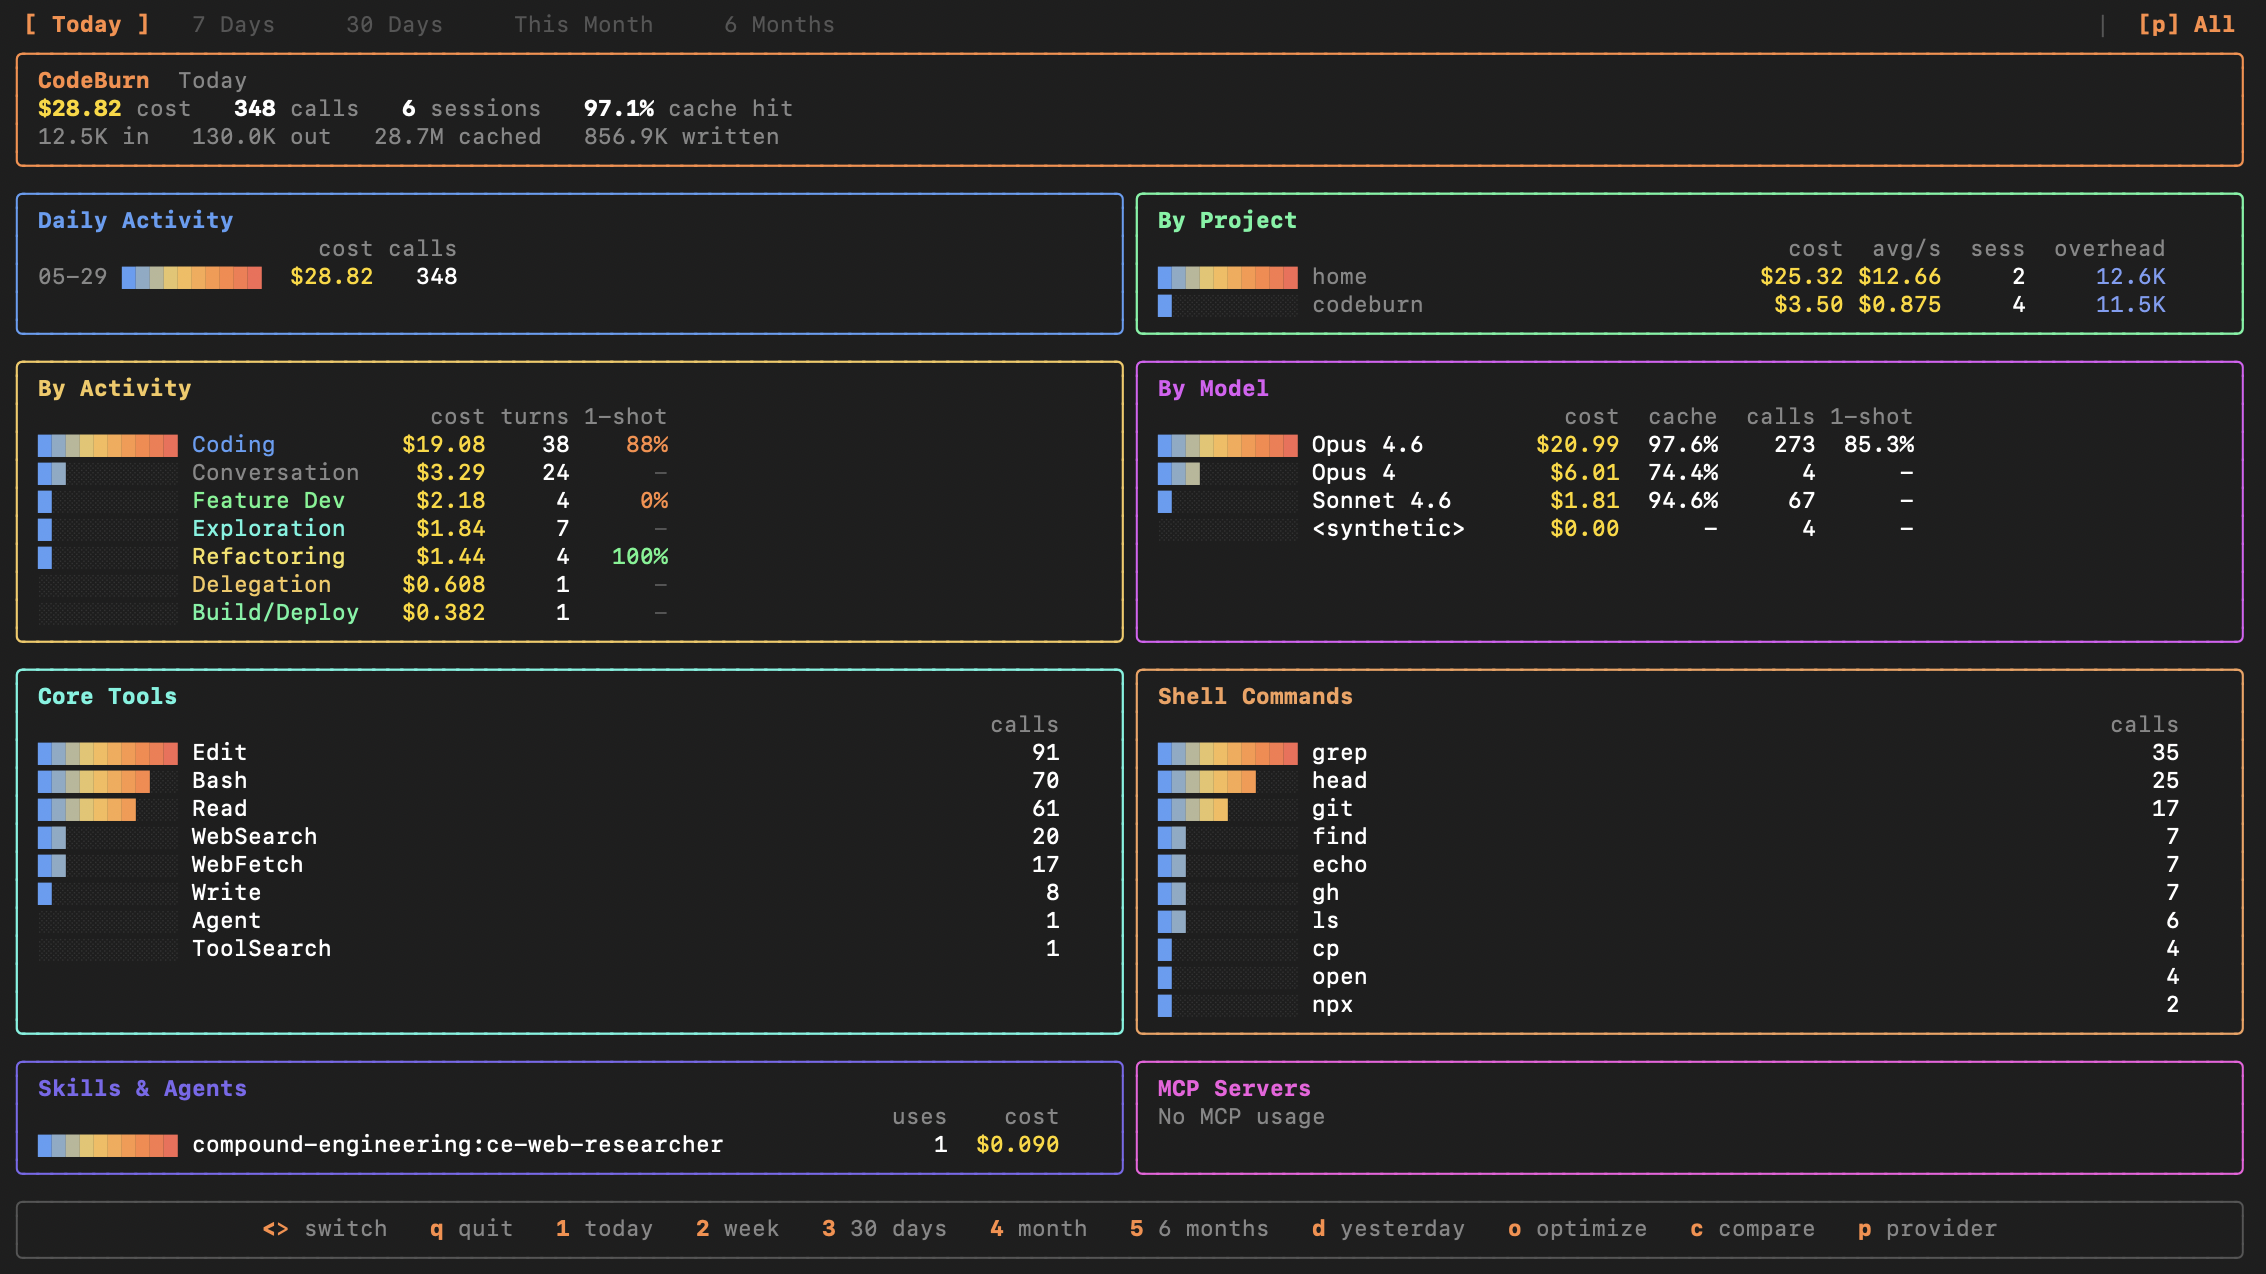
Everything is on one screen. Top row: total cost, number of API calls, sessions, and cache hit rate. Below that: daily cost chart, per-project breakdown with average cost-per-session, activity categories with one-shot rates, model usage, core tool distribution, and the exact shell commands your AI ran.
The activity panel is where it gets interesting. CodeBurn classifies every API call into 13 task categories based on tool usage patterns and message keywords. Coding, Conversation, Feature Dev, Exploration, Debugging, Refactoring, Testing, Delegation, Git Ops, Build/Deploy, Brainstorming, Planning, and General. The classification is fully deterministic. No LLM calls.
In the screenshot above, Coding accounts for $19.08 across 38 turns with an 88% one-shot rate. Conversation is $3.29 across 24 turns. That ratio matters. If Conversation consistently dominates your spend, you are paying for chat, not output.
Model Breakdown by Task
The models command gives you a per-model cost table. Add --by-task and it explodes each model into rows for every task type it was used for.
codeburn models --by-task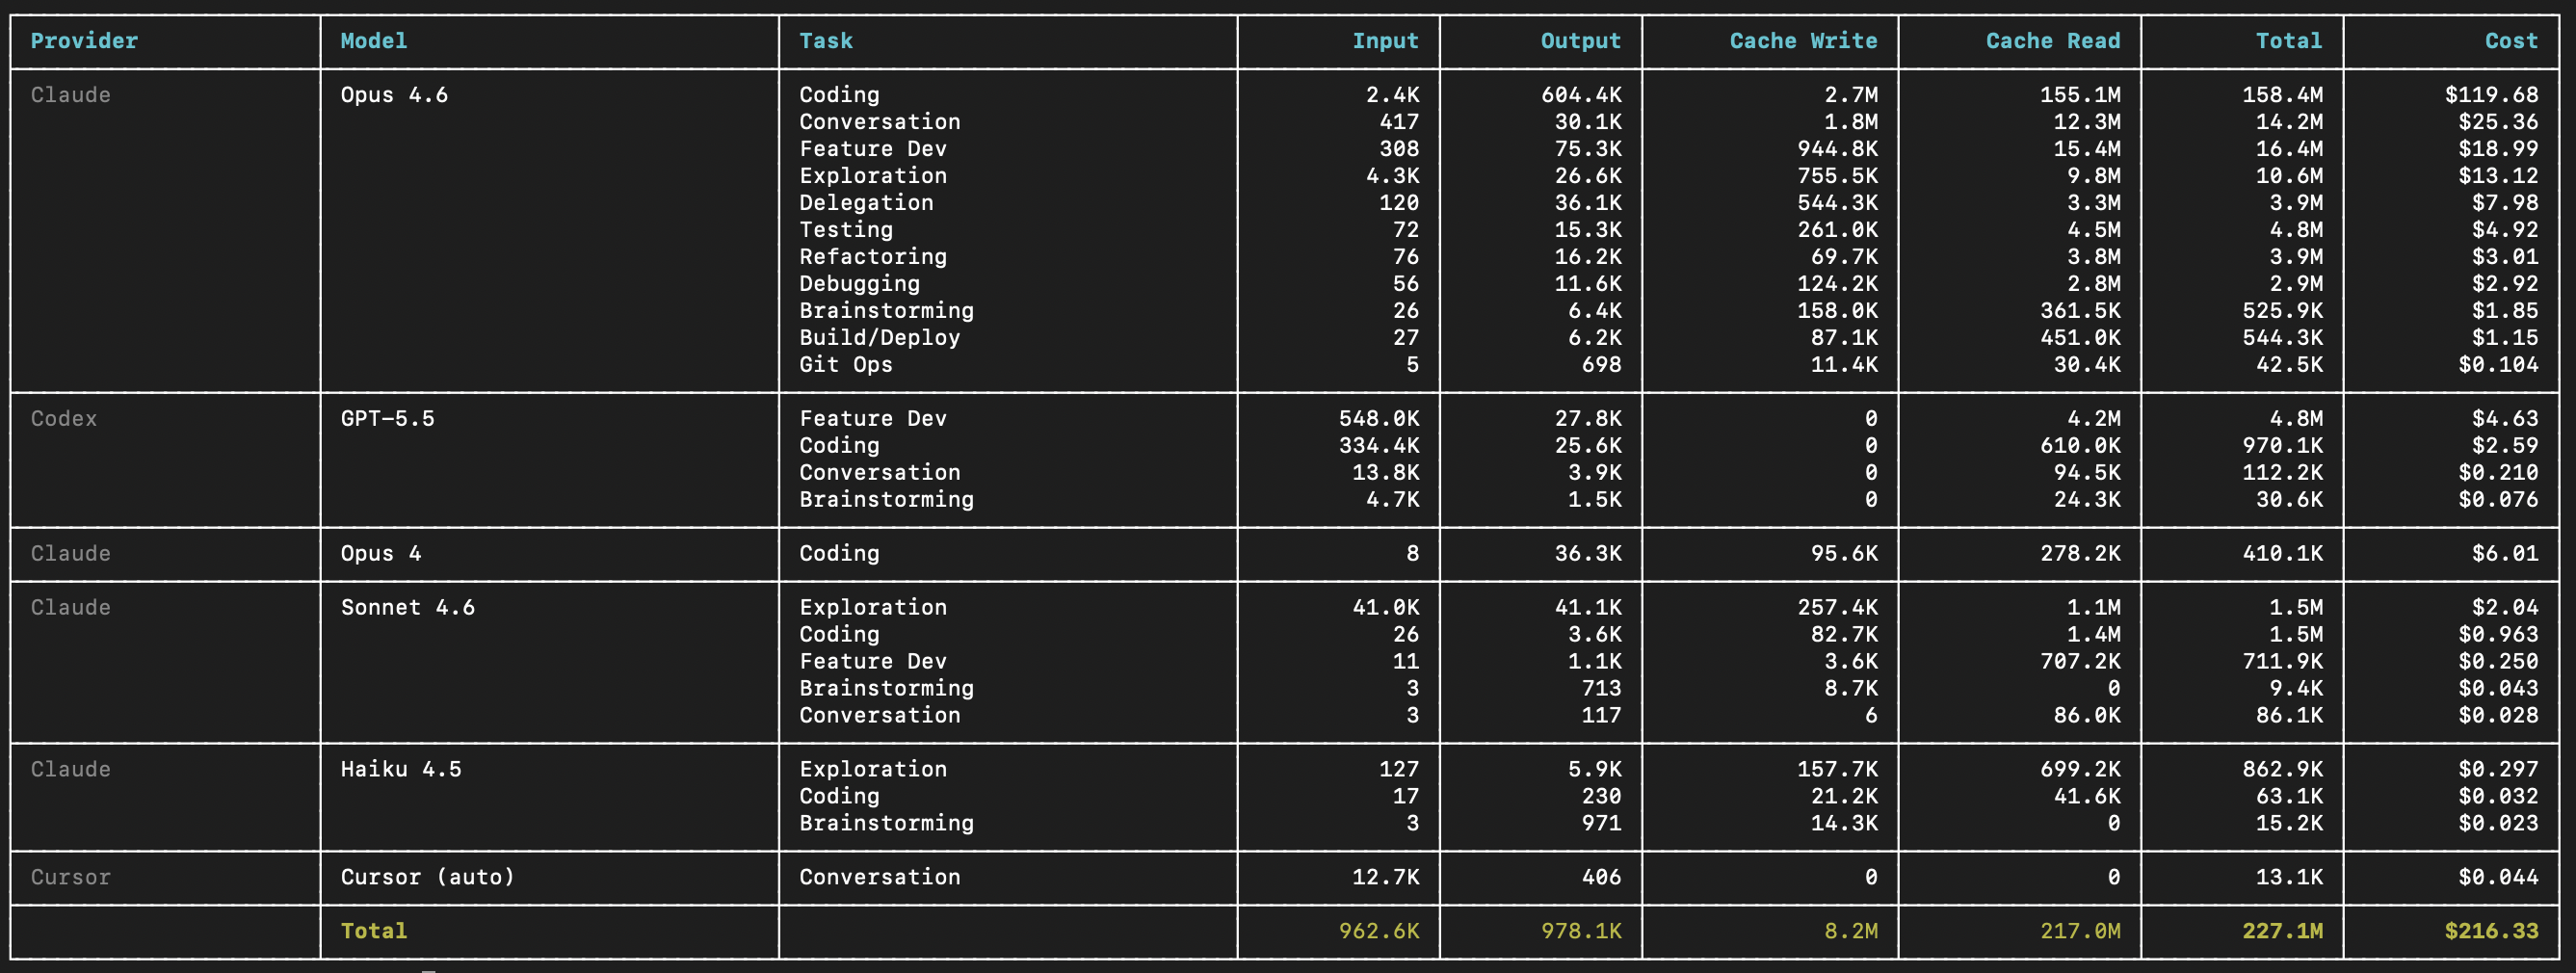
This is real data from a 30-day window. Opus 4.6 spent $119.68 on Coding alone, with 604.4K output tokens and 155.1M cache reads. GPT-5.5 on Codex did $4.63 on Feature Dev and $2.59 on Coding. Sonnet 4.6 handled Exploration for $2.04 with 1.1M cache reads. Haiku 4.5 did lightweight Exploration at $0.297.
The table shows Input, Output, Cache Write, Cache Read, Total tokens, and Cost for every combination. You can see exactly where each model earns its keep and where it might be overkill.
codeburn models --task debugging --provider claude
codeburn models --top 5
codeburn models --format markdown
Filter by task, provider, or limit to top N. The markdown format is useful for pasting into PRs or team docs.
Waste Detection
The optimize command scans your session history and your local config for specific, fixable waste patterns. Every finding includes the estimated token and dollar savings, and a ready-to-paste fix.
codeburn optimize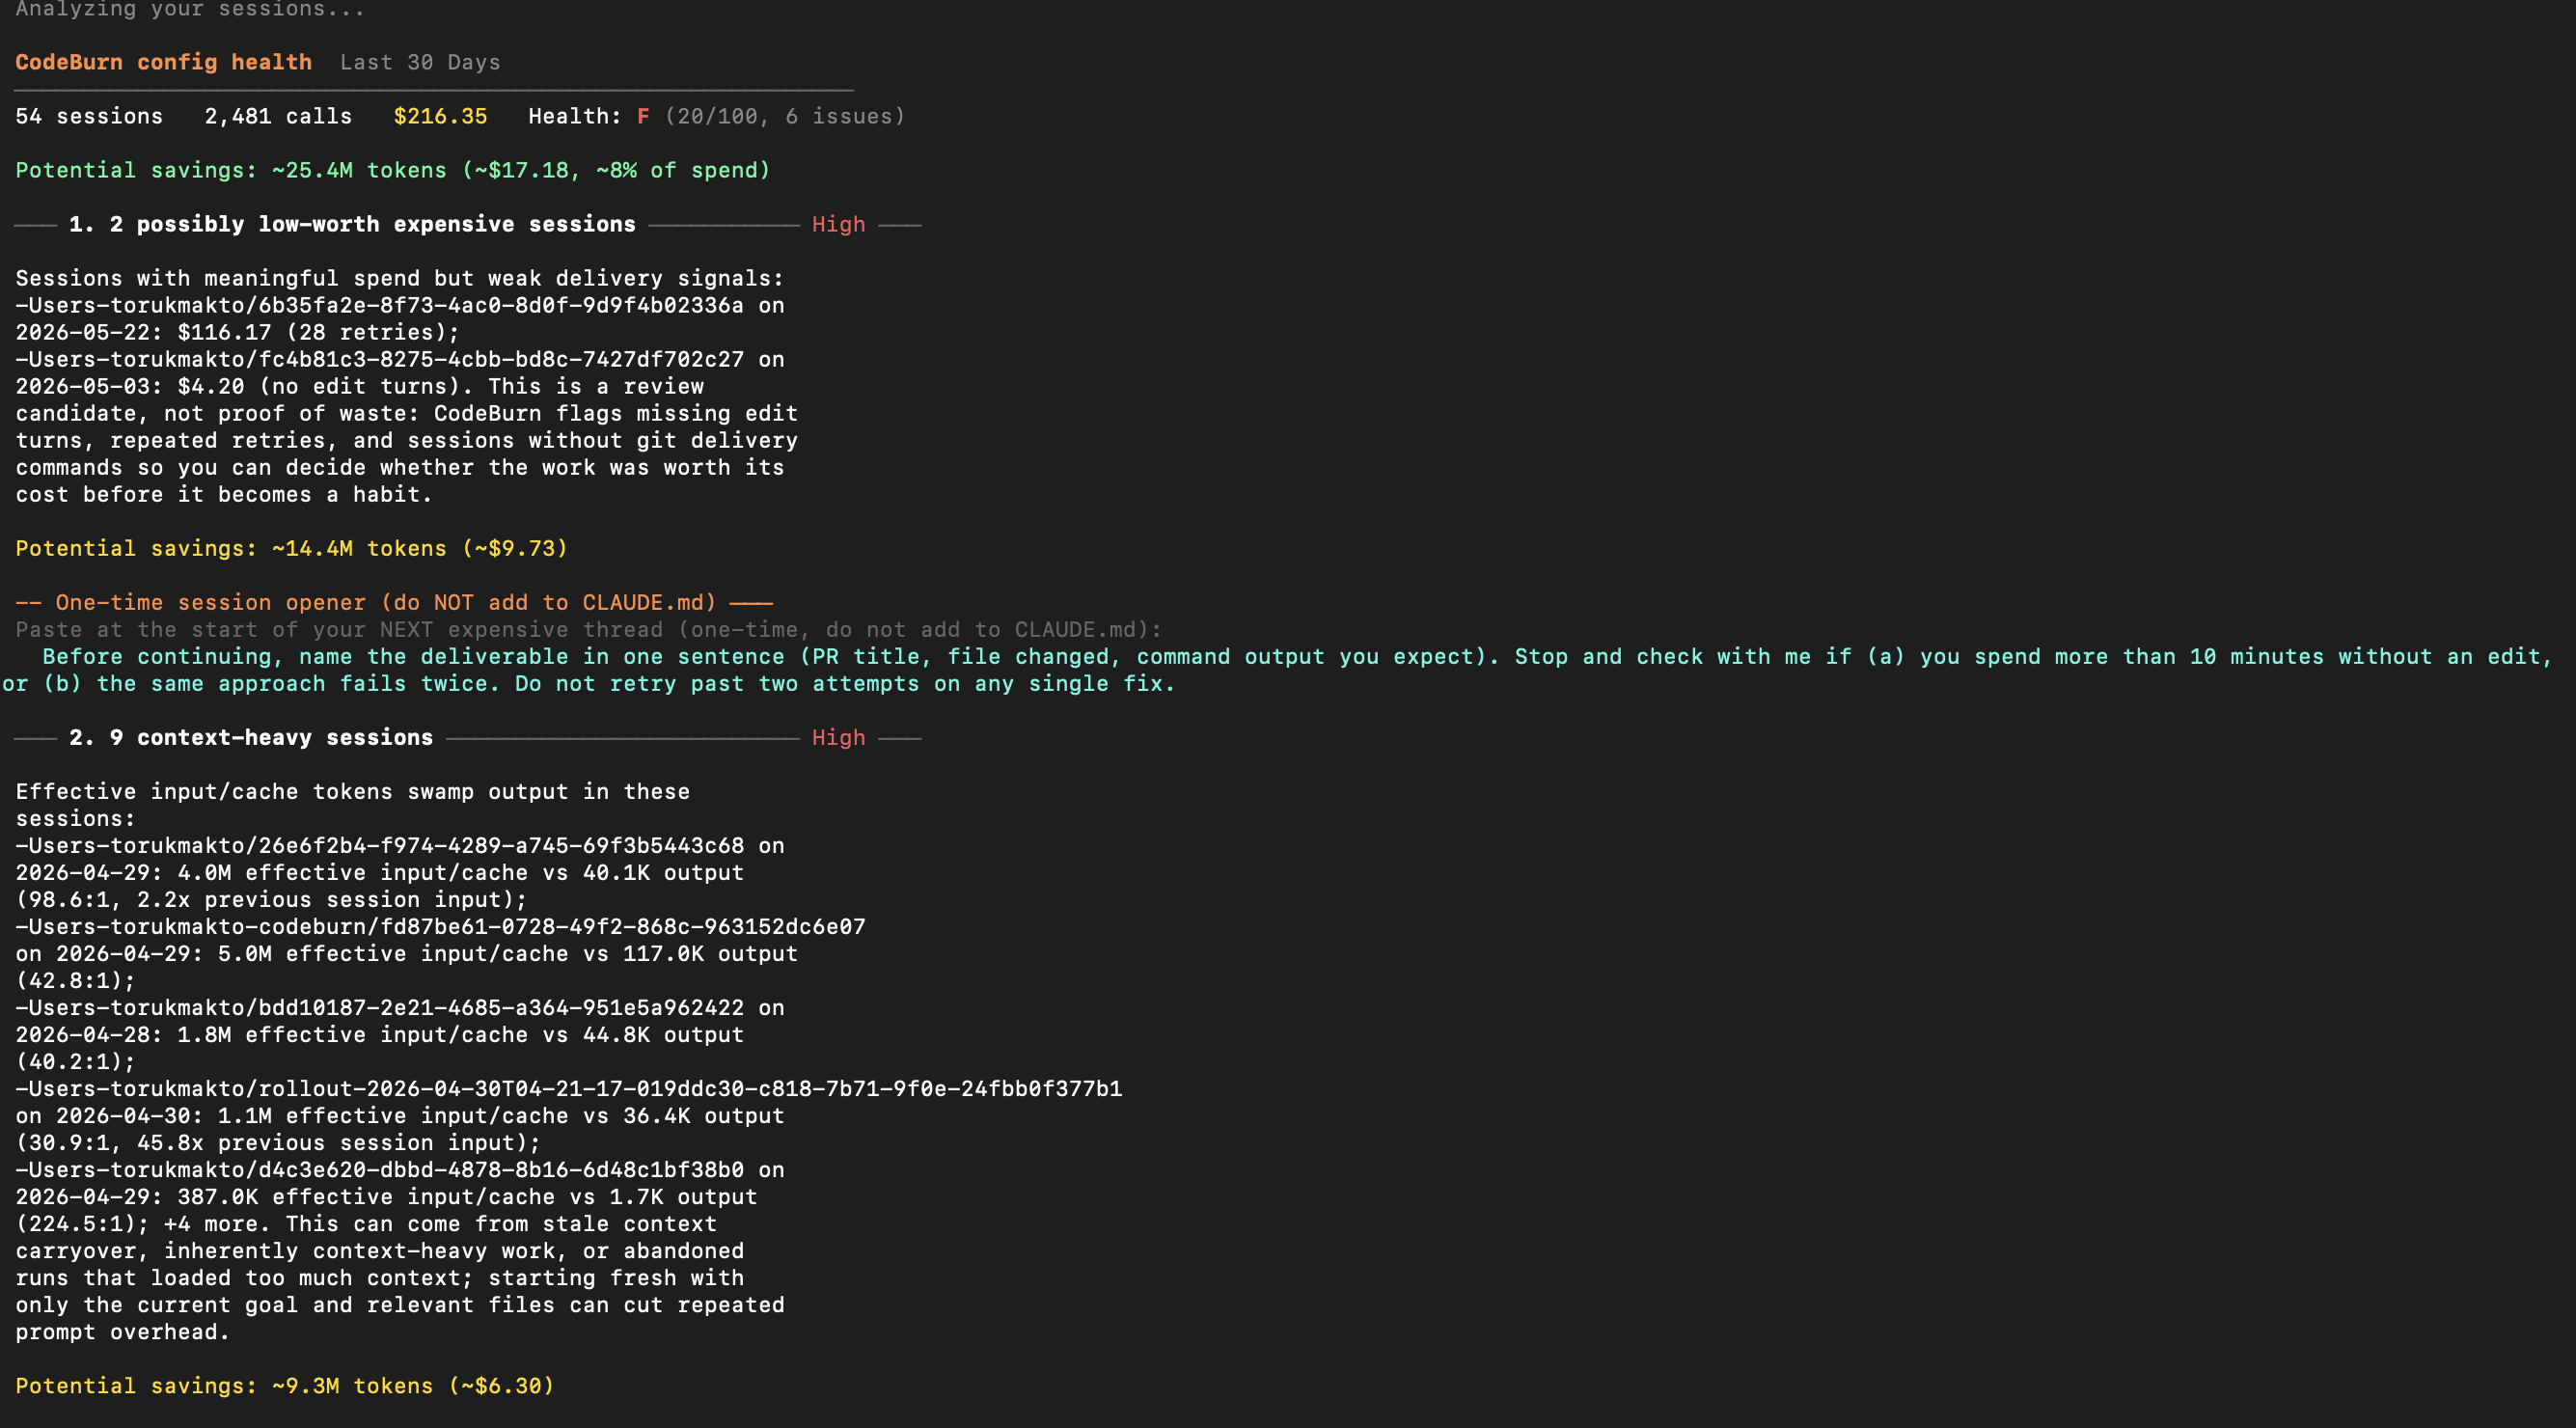
This scan found 6 issues across 54 sessions and $216.35 of spend. Total potential savings: ~25.4M tokens, roughly $17.18 or 8% of the total. The setup health grade is F (20/100).
The first finding flags 2 expensive sessions with weak delivery signals. One session cost $116.17 with 28 retries. Another cost $4.20 with no edit turns at all. These are review candidates, not proof of waste. CodeBurn flags them so you can decide whether the work was worth its cost before it becomes a habit.
The second finding identifies 9 context-heavy sessions where input/cache tokens swamp output. One session had 4.0M effective input vs 40.1K output (98.6:1 ratio). That usually means stale context carryover or abandoned runs that loaded too much.
Things optimize catches:
- Duplicate file reads across sessions. Fix: add to CLAUDE.md context.
- Uncapped bash output. Fix:
export BASH_MAX_OUTPUT_LENGTH=4096 - Unused MCP servers. Each adds tool-schema overhead to every message.
- Ghost agents, skills, and slash commands. Defined but never invoked.
- Bloated CLAUDE.md files. Counted with
@-importexpansion. - Low-worth expensive sessions. High cost, no edits, no delivery.
- Context-heavy sessions. Input:output ratio above 25:1.
- Session outliers. Sessions costing 2x+ the project average.
Run it again after making changes. It tracks state over a 48-hour window and classifies each finding as new, improving, or resolved.
Model Comparison
The compare command puts two models side by side with performance and efficiency metrics drawn from your own usage data.
codeburn compare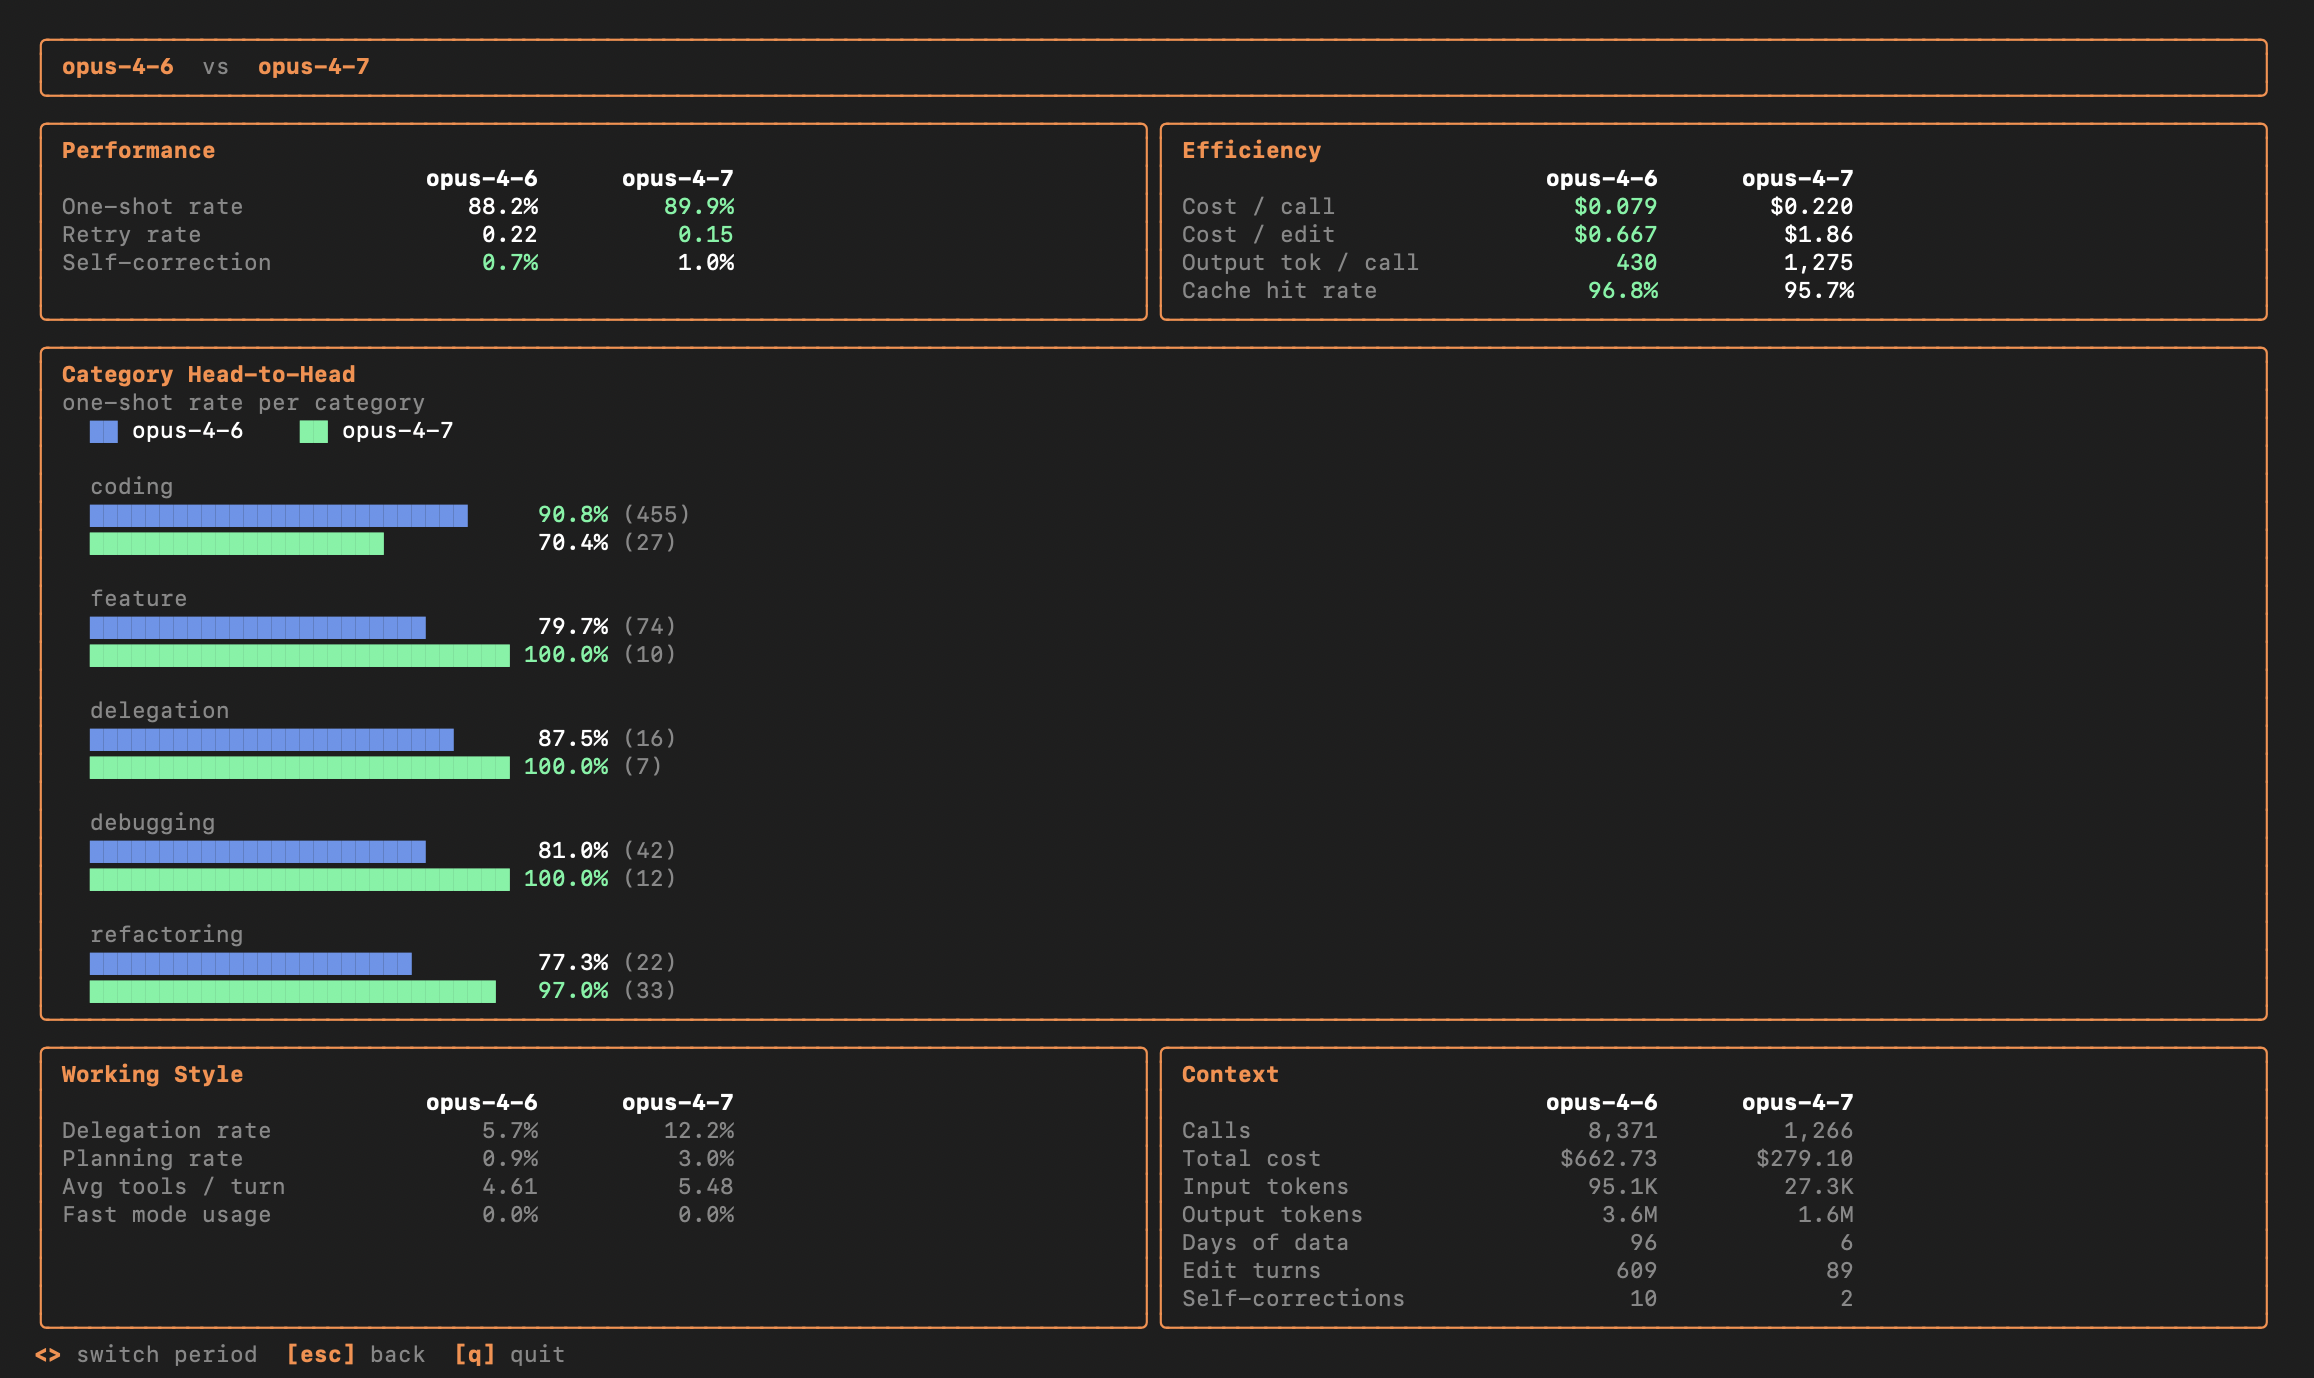
This comparison shows Opus 4.6 vs Opus 4.7 from real sessions. Opus 4.6 has an 88.2% one-shot rate across 8,371 calls and $662.73 total cost. Opus 4.7 has 89.9% across 1,266 calls and $279.10.
The Category Head-to-Head breaks it down further. On coding tasks, Opus 4.6 gets 90.8% one-shot (455 turns) while Opus 4.7 gets 70.4% (27 turns). On debugging, Opus 4.7 hits 100% across 12 turns. The numbers tell a nuanced story: one model is not universally better. It depends on the task.
Working Style panel shows delegation rate, planning rate, average tools per turn, and fast mode usage. Context panel shows total calls, cost, input/output tokens, edit turns, and self-corrections.
Yield Tracking
The yield command answers the question most cost trackers ignore: did any of this code actually ship?
codeburn yield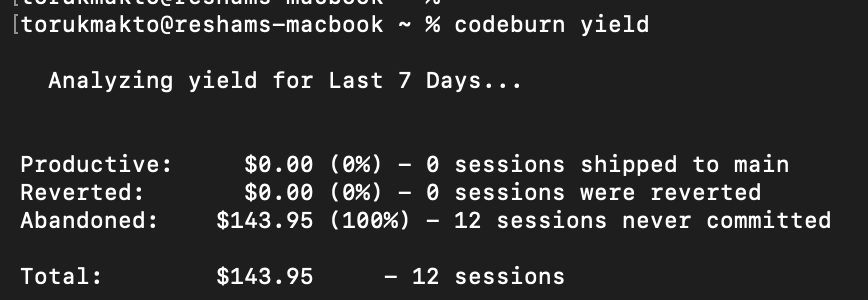
It cross-references AI session timestamps with git commit history. Each session gets classified:
- Productive: commits from this session landed in main.
- Reverted: commits were later reverted.
- Abandoned: no commits near the session, or commits never merged.
In this example, $143.95 across 12 sessions was classified as Abandoned. That does not mean the work was wasted. Research, prototyping, and exploration often do not produce commits. But if you see this pattern consistently, it is worth asking whether those sessions produced value or just burned tokens.
Subscription Plans
Track whether your subscription is worth the price.
codeburn plan set claude-max     # $200/month
codeburn plan set cursor-pro     # $20/month
codeburn plan set custom --monthly-usd 200 --provider codex
The dashboard shows overage tracking per provider. If you are on Claude Max at $200/month but only using $80 of API-equivalent value, you might be better off on Pro. If you are consistently hitting $300+, the subscription is saving you money.
31 Providers, Zero Config
CodeBurn auto-detects which AI coding tools you use by reading session data from their default locations on disk. No setup required.
Supported tools: Claude Code, Claude Desktop, Codex, Cursor, Gemini CLI, GitHub Copilot, Goose, Windsurf (Antigravity), Cline, Roo Code, KiloCode, OpenCode, Kiro, Kimi Code CLI, Mistral Vibe, IBM Bob, Droid, OpenClaw, Pi, OMP, Qwen, and Crush.
If you use multiple tools, press p in the dashboard to toggle between them, or use the --provider flag on any command:
codeburn today --provider claude
codeburn models --provider codex
codeburn optimize --provider cursor
Menu Bar and GNOME Extension
On macOS, codeburn menubarinstalls a native Swift app that sits in your menu bar. It shows today's spend at a glance. Click to open a popover with agent tabs, period switcher, trend and forecast data, activity breakdown, and export options. Auto-refreshes every 30 seconds.
On Linux, a GNOME Shell extension provides the same functionality in the top panel.
Export and Automation
Every view has a machine-readable output format.
codeburn report --format json          # full dashboard as JSON
codeburn status --format json          # compact today + month
codeburn export                        # CSV
codeburn export -f json                # JSON export
codeburn report --format json | jq '.projects'
The JSON output includes every panel from the dashboard: overview, daily breakdown, projects, models with token counts, activities with one-shot rates, core tools, MCP servers, and shell commands. Pipe to jq, feed into a dashboard, or build automations on top of it.
Get Started
One command. No account. No data leaves your machine.
npx codeburn@latestOr install globally:
npm install -g codeburn
brew install codeburn